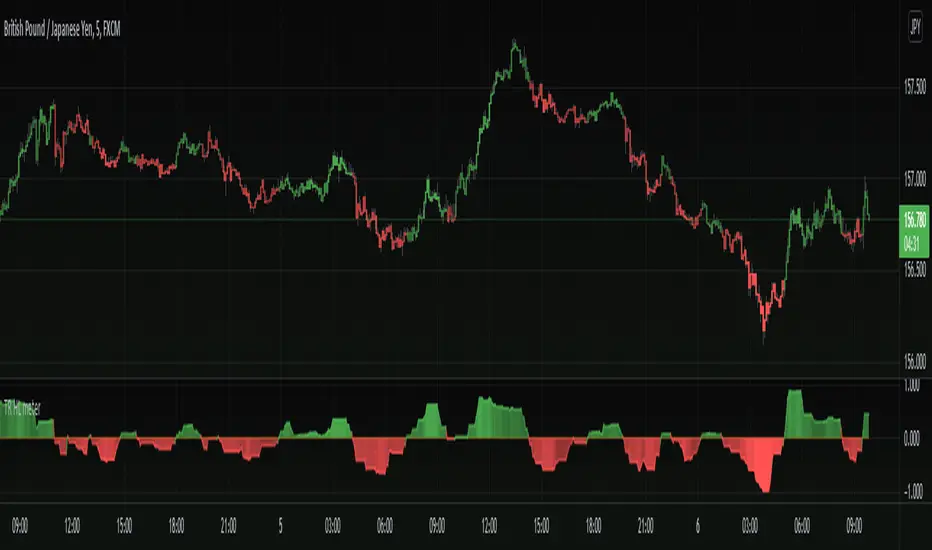
Custom Time ranges. Daily price ranges.Addition to previous time range script, now containing daily ranges. You can select a day of the week, and have it show the high, low, mid, and open of that day.
For the time bands:
Monday = 2
Tuesday = 3
Wednesday = 4
Thursday = 5
Friday = 6
Saturday = 7
Sunday = 1
Example 1:
1500-1800:2
This will colour the background between 3pm and 6pm on Mondays.
Example 2:
0000-0600:247
This will colour the background between midnight and 6am on Mondays, Wednesdays, and Saturdays.
For the Daily price ranges:
Just select the tick-box forthe day, and then the price levels you'd like to see.
I want to add specific weekly levels to this, for example: week 06 of year 2020, but I've not figured out how to do it yet. If anyone knows, I'd appreciate it if you let me know. I'll then update this script.
As always, any questions you may have, please leave in comments below and I'll respond when I have time.
If you notice anything good with this indicator, let me know. We are all in this to make money after all! ;)
ค้นหาในสคริปต์สำหรับ "high low"
Pivot Points High Low (HH/HL/LH/LL) [Anan]Hello Friends,
This is my own version of ( Pivot Hilo Support n Resistance Levels R3-3 by JustUncleL )
- V4 Pinescript
- Removed MA dependency filters
- Add some arrows
Previous OHLC LevelsQuick dirty code for personal use. Plots previous OHLC levels based on a selected time-frame on the chart.
Not bad if you want to see different time-frame levels.
Fill function can serve to highlight the daily range (high-low or open-close) on non-standard charts
Uses base code from JayRogers
Open-high-lowmodified @traderXO's original daily open/high/low script to include monthly and weekly open.
Standard Deviation using high, low, closeEvery standard deviation tools just only consider one source to compute std, but this tool also consider close, high, low to publish std
Pivot High Low Pointsby using this script you can find Pivot High-Low Points. This script works like Tradingview pivothigh & pivotlow functions.
If you find my works useful, please consider a donation
BTC: 16XRqyS3Vgh1knAU1tCcruqhUrVm4QWWmR
by LonesomeTheBlue
Current Open/Previous High Low Close. Gap HighlightedThis script plots the current open previous high low close. Also the area between the current open and previous close are highlighted to easily see the overnight gap. The idea is that after a significant gap the price will retest previous days levels before continuing in the direction of the gap.
New Highs-Lows AMEX-Buschi
English:
This indicator shows the AMEX's up volume (green) and down volume (red).
Extreme trading days with more than 90 % up or down volume are marked via lines (theoretically values) and triangles (breaches).
Deutsch:
Dieser Indikator zeigt das Aufwärts- (grün) und Abwärts-Volumen (rot) der AMEX.
Extreme Handelstage mit mehr als 90 % Aufwärts- oder Abwärts-Volumen ist gekennzeichnet über Linien (theoretische Werte) und Dreiecke (Überschreitungen).
ccid (with high low histogram)So this indicator has the following : CCI where the buy and sell signal can be either cross of the fast the slow and vice versa or cross of CCI bellow -50 and cross down CCI +50
the histogram (blue and red) is made by high low like histogram the buy and sell is based on crossing of the 0 . since its MTF type . you can toon the TF either to the time frame or use lower graph time with higher TF
since both indicator complement each other then I put them together
Previous 2Days High/LowTesting simple range of highs/lows of previous 2 days, for reference, working on every timeframe.
Previous High/Low Current OpenDisplays
Previous Monthly/Weekly/Daily High/Low over current prices
Current Monthly/Weekly/Daily Open over current prices
Consecutive Highs/LowsTrack consecutive new highs/lows outside the Donchian range. Fans of the oldschool Turtle Strategy should enjoy the visualization.
Same logic as my "Walking the Bands" script, just with Donchian breaks instead of Bollinger tags.
Chart Mojo Noiz Day High/LowThis is an intraday indicator that indicates days high, low, mid range (50%), and vwap. I use it on a 5 min chart or under. Its for range trading, also breakouts, and I use the zone between the 50% of range and vwap as a target during the day at certain times..it has "gravity" ..when traders unwind and or position ahead of something, news or certain time zones with tendencies etc price is drawn towards it. Thanks to Noiz for working on the script. Hope it gives you some Chartmojo.
Pivot Points High Low ExtensionPivot Points High Low Extension
See Also:
- A Simple 1-2-3 Method for Trading Forex
- The Classic 1-2-3 Pattern: An Underestimated Powerhouse
- Bulkowski's 1-2-3 Trend Change
ka66: Period-Bounded High/Low LinesIndicator: Period-Bounded High/Low Lines
There's a few similar ones on TradingView already (as expected), nothing particularly special about this, was just fun to write the logic for it, and understand how it might be used to trade.
Interestingly, I just came across the idea from watching Adam Grimes' Chartschool video, "Anticipating Intraday Action":
www.youtube.com
Thought it was pretty neat. Use the "Daily" bound (default) with intra-day interval charts to get the same effect as in the video.
Now, to watch the video for its actual purpose. ;-)
MTF Previous Open/Close/RangeThis indicator will simply plot on your chart the Daily/Weekly/Monthly previous candle levels.
The "Auto" mode will allow automatic adjustment of timeframe displayed according to your chart.
Otherwise you can select manually.
Indicator plots the open/close and colors the high-low range area in the background.
Hope this simple indicator will help you !
You can check my indicators via my TradingView's Profile : @PRO_Indicators
The Middle-High-Low Moving AverageA standard EMA and a Middle-High-Low EMA give a good signal when they cross
Kay_High_LowPrevious High low plotting.
COPIED from Chris Moody's script and adjusted it for my needs.


